OrgPlus 6.0 has over 40 new features. Here are some highlights:
OrgPlus 6.0.2 Highlights
OrgPlus 6.0.1 Highlights
Quick Chart Creator
The fastest way to get started with OrgPlus is to use the Quick Chart panel. The Quick Chart feature centralizes all the controls you to create basic organizational charts into one easy to use panel.
Search Panel
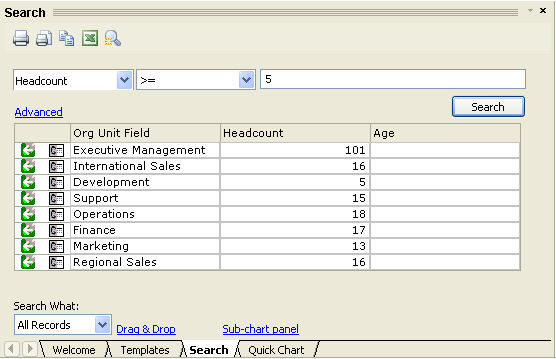
The search panel displays a tabular list all records based on a user defined query. The search panel is useful for finding any set of employees, data mining and succession planning.

Improved Orphan Management
If your data does not contain hierarchy information or your data contains a large number of unassigned positions, OrgPlus 6 makes orphan management easy by allowing you to drag and drop employee records into your charts or sub-charts.
Free Form Tool
OrgPlus automatically positions chart boxes based on the selected branch style. From time to time, automatic positioning of chart boxes may not meet your charting requirements. The free form tool allows you to arbitrarily position boxes within your chart.

Multiple records per box
You can create boxes that contain more then one record. For example, the entire sales team for an organization can be represented in a single box.

Improved Box Layout
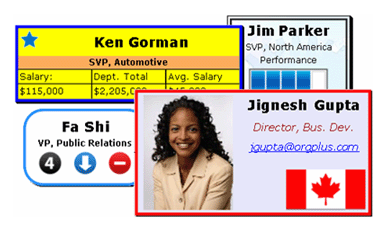
OrgPlus 6 now gives you more control over box layout. For example, you can use conditional formats to control which icon is displayed in each box.

Consolidation
Some organizations may want to combine multiple organizational charts into a single chart. One common scenario is that each division within a company is responsible for maintaining their own organizational chart using OrgPlus. Using the consolidation feature, each division’s chart can be combined into a single master chart.*
Hotspots
OrgPlus 6 lets you define any area within a box as a hotspot. When the user moves the cursor over a hotspot a profile is dynamically displayed.

Improved Publish and Print
Numerous enhancements have been made to improve publish and print quality.
Enhanced Data Import
The import wizard now gives you more data import options.
Constants (What-if analysis)
OrgPlus 6 allows you to define constants that you can use in formulas, conditional formats and chart rules. Changing the value of a constant will update every chart element that references that constant. For example, you can define a conditional format that sets the color of a box based upon whether an employee was hired before or after a specific date. If you reference a constant called “cutoff date” in the conditional format, you can now easily visualize the impact of changing the “cutoff date” to different values.
Compare Charts
OrgPlus allows you to compare two charts. After comparison a report containing the differences between the two charts is generated.
Improved Reports
The reporting features now allows you generate tabular reports that are grouped by relationship (peer, manager, subordinate).
Legends
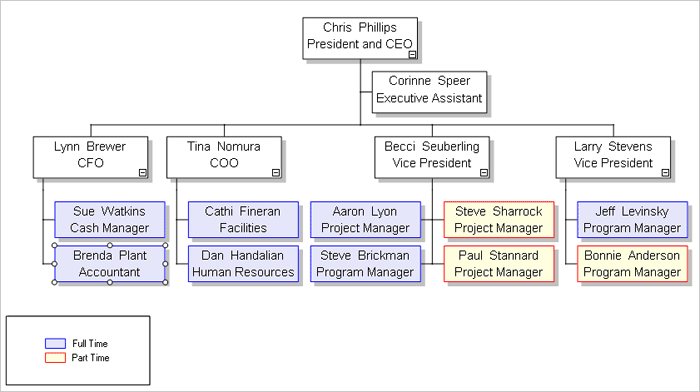
You can now add legends to your charts. Each legend contains one or more color coded legend entries to help end users understand your charts.

Improved Auxiliary lines
Auxiliary lines are now easier to add and maintain. You can even specify auxiliary lines in your data source using the AuxReportsTo advanced data field.
New Advanced Data Fields
OrgPlus has two additional advanced data fields that can be used during the import process. The Format field enables you to specify the format of any box in the chart. The Special field allows you to ignore any row in your import file or to specify chart formatting parameters such as background and chart title.
Improved Formulas
OrgPlus 6 now lets you define more complex formulas including calculations that operate on date fields.
Improved Sub-charting
Pick any one of five different sub-chart arrow styles.
Direct Access to SAP
OrgPlus 6 allows you to import data directly from SAP using the SAP HR-OCI (Organizational Charting Interface). SAP HR-OCI guarantees compatibility with all future versions of SAP and does not require you to load custom software into your SAP environment.**
Multi-Level Demote
The demote function allows you to drop any box down one or more levels in a chart.
OrgUnit Charts
Create a chart of Org Units (or departments) from the hierarchy shown in the sub-charts panel.
Select Similar
Format charts faster. Right-click on any box to select boxes with similar formatting.
OLE DB Support
OrgPlus 6 now supports data import from any OLE DB compatible data source.*
New Branch Styles
OrgPlus 6 contains two new branch styles.
*Feature is only available in OrgPlus Professional
**Requires purchase of the OrgPlus SAP HR-OCI adapter.
OrgPlus 6.0.1 Highlights
Image Library
The My Charts folder now contains a library of images that you can use in your charts. The image library is located in the My Documents/My Charts/Symbols folder on your computer.

508 Compliance
OrgPlus desktop products are now 508 compliant (U.S. Government standard for designing software to meet the needs of people with disabilities).
Improved Box Layout
OrgPlus now allows you to set the background color and border style for any cell within a box. Field labels in boxes can now be placed anywhere in a box (above, below, left or right of the corresponding field). OrgPlus also allows you to create fixed size boxes and fixed size columns within boxes.

Improved Performance
OrgPlus has been optimized to increase the speed of general operations including import, data refresh and publish.
OrgPlus Online Integration
The automation features of OrgPlus and the new “Push Data” functionality make it easy push charts to OrgPlus Online.
Mapped Fields
Mapped fields allow you to map from one value to another value. For example, USA = www.mycompany.com/flags/usflag.jpg.
| Value |
Maps to |
Result |
| US |
/images/usflag.jpg |
 |
| CA |
/images/caflag.jpg |
 |
| NL |
/images/nlflag.jpg |
 |
| CN |
/images/cnflag.jpg |
 |
Improved Hyperlinks
Hyperlinks can now be attached to free-floating objects such as pictures, shapes and textboxes.
Improved Conditional Formats
Box layouts can now be copied from a selected box, which makes defining complex conditional formats easier. In addition, users can clear conditional formatting parameters on a tab-by-tab basis within the box layout dialog.
Sub-chart # AutoText element
Easily identify where a sub-chart fits into the overall hierarchy by using the Sub-chart # AutoText elements. Each sub-chart is given a unique number (for example, 1.1.2 or 1.3.1) which makes it easy to collate printed output.
String Functions
OrgPlus now supports string functions that allow users to extract a sub-string from a field.
Import Data Enhancements
OrgPlus now gives you more control over rolling up records into multi-record boxes during import and data refresh.
OrgPlus Reader Optimization
The Save As function allows you to embed referenced pictures, remove original data source reference, strip hidden fields and convert formulas to values.
Improved Publishing
Publish to PowerPoint now supports inclusion of sub-chart arrows.
Improved Conditional Formats
OrgPlus speeds up the definition of conditional formats, groups, conditional formulas, reports, etc. by allowing you to select from an auto-populated list when performing any field comparison.
OrgPlus 6.0.2 Highlights
Publishing Enhancements
You can now add AutoText elements to the cover page of published documents. For example, you can include the date the chart data was last refreshed.
OrgPlus Plug-in Security
When you publish to the OrgPlus Plug-in, you can require end users to enter a password and/or a user name in order to gain access to charts.
Easier formatting
Use the toolbars to set field borders and field fill colors.

Enhanced Installer
You can now control installation of the OrgPlus toolbar into Microsoft Office applications.
Improved MS Office Integration
Select which version of OrgPlus you want to launch when opening org charts embedded into MS applications.
Support for data sources using Org Unit Management
In addition to importing data stored using supervisor and position management, you can now import data that contains hierarchies stored using secondary relationships such as departments or org unit hierarchies.
|